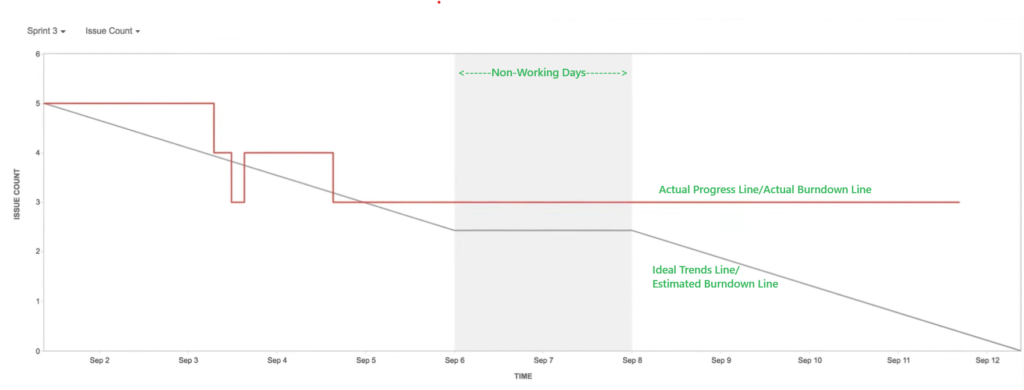
A burndown chart is a graphical representation used in agile project management to track the progress of work in a sprint or project. It shows the amount of work remaining versus time. The key elements of a burndown chart are:
- X-Axis (Horizontal): Represents time, typically in days.
- Y-Axis (Vertical): Represents the amount of work remaining, measured in story points, hours, or tasks.
- Ideal Trend Line: A straight line from the top left (start of the sprint) to the bottom right (end of the sprint), representing the ideal progress to complete all tasks by the end of the sprint. Indicating in Gray color in below image.
- Actual Progress Line: Plots the remaining work at the end of each day. It shows how the team’s actual progress compares to the ideal trend line. Indicating in Red Color in below image.
Benefits of Burndown chart
- Visual Progress Tracking: Provides a clear, visual way to track whether the team is on track to complete the sprint goal.
- Early Problem Detection: Helps identify if the team is falling behind schedule early, allowing for timely corrective actions.
- Motivation: Can motivate the team by showing steady progress towards the goal.
In Project Management perspective, the burndown chart falls within the Monitoring and Controlling process group in project management, specifically in agile methodologies. It is part of the Scrum framework, which is an implementation of agile.
In Traditional Project Management, there is a process called Control Schedule, which falls under Project Schedule Management knowledge area, of Project Manager Professionals. In Agile we can control schedule by activity of Sprint Review and Daily Stand-ups.
Tools and uses of Burndown chart
In JIRA, for instance, the burndown chart is automatically generated and updated in real-time as tasks are completed. It helps teams to:
- Monitor sprint progress daily.
- Adjust workload if the actual progress line diverges significantly from the ideal trend line.
- Reflect on their sprint performance during the sprint review meeting.
Using a burndown chart effectively helps agile teams maintain transparency, stay on track with their sprint goals, and continuously improve their processes.